Part 1: Building up an online web presence Part 2: Inbound marketing (SEO and PPC) Part 3: Inbound marketing (location based, local, blogging, email, affiliate) Part 4: Setting up and understanding Google Analytics Part 5: Conversion rate optimization and A/B testing
After talking about different inbound marketing fields, I am going to dedicate this part to the important topic of website analytics. It is crucial to see how many visitors a website has and what they are doing. For example, which pages are visited the most and which ones convince visitors to complete a certain action. The data which analytics tools provide can be used to measure:
the success of your marketing activities your website’s performance if you are on the way to reach your pre-defined goals
One fundamental thing is not only to look at the data, but also to make changes accordingly. I know from my own experience that it’s very easy to look at some graphs and values regularly simply to cheer oneself up or to be disappointed by negative trends. For example, I always have a browser tab opened with the Google Analytics Live View to see how trendblog.net is currently doing. Therefore, always keep in mind that it is important to make changes to your website and your online marketing activities based on the data you have. Otherwise, time spent with analytics tools is time wasted! Shane Melaugh from imimpact.com couldn’t have said it better: With that in mind let’s move on to setting up Google Analytics, the free and most used website analytics software. If Google Analytics is already set up on your website you can skip this part and click here to get to the description of the main Analytics sections.
How to setup Google Analytics on your website
Step 1: Sign up for an account
To sign up, simply visit the Google Analytics website and follow the onscreen instructions after clicking on the “Create an account” button.
Step 2: Setting up your account, property and profiles
Once you have an account, you can add properties and profiles to it. A property can be a website, mobile app or a blog. A profile is a defined view of visitor data from a property. This is where you get your reports. By default, every property starts with one (unfiltered) profile. You are able to add more profiles with applied filters to a property. This makes sense if you, for example, want to see only data from AdWords traffic or the traffic to a subdomain on a frequent basis.
Step 3: Set up your tracking code
After entering all details, you get a tracking ID which has to be inserted into all your website pages. It is recommended that you insert the code snippet in the head section of your website, right before the endingtag. If you are running your website on a CMS, then I recommend using an analytics plugin which will do the job for you. A good one for WordPress is the “Google Analytics for WordPress” plugin from Yoast.
Step 4: Link your Analytics account to Google AdWords and AdSense
If you are using AdWords or AdSense you should link them to your Analytics profile to have all data in one place. This way, you can include these platforms in your Analytics reports. To link your AdSense account, simply go to your AdSense account settings where you can do the necessary steps in the “Access and Authorisation” part. Use this step-by-step guide to link your AdWords account with Analytics and make sure to check out our AdWords beginner’s guide.
Step 5: Set up goals to track conversions
Setting up goals in Google Analytics helps you to track certain actions or conversions of your site visitors, such as newsletter sign ups or downloads. Depending on what you want your visitors to do on your site, you need to set up specific goals within Analytics to be able to track them. You can set up goals based on:
a URL destination visit duration visited pages per visit a defined event (read more)
In Analytics, click on the Admin tab in the upper right corner and click through to the profile you want to set goals in. Then, click on the “Goals” tab where you can set up and edit your goals. Being able to set goals and track conversions is a great help when you want to evaluate your website and marketing performance.
Step 6: Tag your campaigns
Start tracking your marketing efforts, such as newsletter, banner and social posts, more in-depth by adding so-called UTM parameters to your links. That way, you’re able to see exactly on which campaign link a visitor clicked to get to your site. That is especially important for email marketing. Normally, if someone clicks on a link in your email without these parameters, Analytics won’t put the right source on that visit and dump it in the so-called source (direct) / (none). Use the Google Analytics URL builder to start tagging your links.
Step 7: Create custom Dashboards
Dashboards in Google Analytics can be a big help and save you time by displaying only the data which is most important to you. This way, you have everything in one place if you just want to get a quick overview of your site’s performance. You can easily set up custom Dashboards when you click on Dashboards and then on New Dashboard in the “My Stuff” section on the left sidebar. Here you can find some pre-built Google Analytics Dashboards which can be easily imported.
Brief introduction of the main sections of Google Analytics
Below I’m giving you a basic description of each section of Analytics so that you know where to get which kind of data. At the end of this post are links to additional resources where you can find more in-depth information.
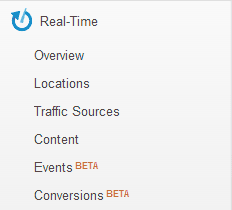
Real-Time
This section shows, as it is already pointing out, real-time data of current site visitors. You’re able to see here how many people are on your site, where they are, their geographical location and their traffic source. You shouldn’t put too much weight on that data since it only captures a single moment and no longer and more significant time period. But it is definitely nice to see what is going on on your website at the moment.
Audience
The audience section covers the characteristics and behavior of your site visitors. In the different parts you can find out about your visitors’ location, how they browsed your site and if they used a mobile device, for example. Some important stats you should know about:
Unique Visitors:
Number of actual visitors who visited your site in a defined period of time. Pages / Visit: Number of pages a person visited before he left the website. The higher the value the more engaged are your visitors (one possible explanation).
% New Visits:
Here you can see the ratio of new visitors against returning ones. If you hardly get any returning ones, then there might be something wrong. Maybe there’s no good reason to come back.
Bounce Rate:
This percentage tells you how many visitors leave your site (bounce) without taking any action, such as visiting another page. A bounce does not have to be negative, though. It can also mean that a visitor found what he was looking for and had no reason to visit other pages (try to give him that reason by optimizing your site). On the other hand, a high bounce rate can also mean that your website is poorly optimized and doesn’t offer a good user experience and easy navigation.
Traffic Sources
Obviously, this part offers you insights about where your site visitors came from. The stats in this part are one of the most important ones, since you can see how many people are coming from
search engines external sites linking to you (referral traffic) paid search results social networks (Facebook, Twitter, Google+, Reddit …)
Analyzing your traffic sources can give you insights on how effective your various marketing efforts are. For example, if one channel brings in a good amount of traffic, you should consider scaling up your efforts there. The other way around, if one is performing bad you have to change your approach.
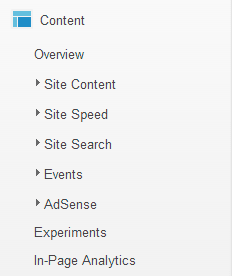
Content
In the content section, all data concerning your single pages can be found. You are able to see how each page is performing and how long it takes for your pages to load. This metric is a major factor of visitor satisfaction. The longer a site loads the more visitor get frustrated and bounce. Check out our WordPress and CDN guide to increase your site speed. The Events subsection allows you to track pre-defined activities on your website which Analytics is not able to, such as clicks on certain buttons or how far a form was filled out. If you want to start tracking events, check out Anna Lewis’s guide on event tracking. Another interesting subsection is Experiments. There, Analytics is offering you the opportunity to conduct tests on your website. You can define two variations of the same page and Analytics will direct visitors to both pages and provide you with performance data, so that you see which one works better for you. Here you can find out more about Google Analytics Experiments.
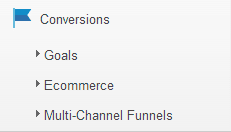
Conversions
This section is all about tracking defined goals, and seeing what channels were used to complete these goals. Google Analytics lets you even see what channels assisted a conversion and which conversion paths visitors mostly go through. If you happen to have an ecommerce shop you can set up ecommerce tracking to receive transaction data, such as product performances, purchase amounts, and billing locations.
External resources
Below you can find a list with relevant links to resources which cover Google Analytics in more detail.
Udemy online course: Getting Started with Google Analytic (for free) Google Analytics: Get the most out of your reports – Setup Checklist Google Analytics: All about profile data filters Google Analytics: Google Analytics IQ Lessons – Learning Center IMImpact: Web stats alternatives to Google Analytics ePower: Google Analytics Glossary
Final words & outlook on the 5th and last part
Setting up a web analytics tool like Google Analytics can consume some time until it’s configured. But it’s worth it! You get tons of data you can use to analyze your website and the effectiveness of your marketing efforts. Make changes based on your data, check and make changes again. This is a never ending process, but without constant testing and optimization your website won’t improve. In the next (and last) part of this series, I go into more detail on optimizing your website, conducting so-called A/B tests and improving conversion rates. If you have any feedback or questions regarding web analytics, feel free to post them in the comments below. Also make sure to subscribe to our newsletter and social media channels to stay up-to-date! Cheers !!!! See : http://www.brandshastra.com This is really a very good post and very much useful to beginners. In your post “seven steps to setup Google Analytics” on your website is really having a good content, it helped me to know briefly about google analytics. Further, I searched other websites for more information and I found one post in the Digital Ready blog on understanding web analytics which helped me to know more briefly about the topic. Δ Contact Us :- trendblog.guest@gmail.com